|
. |
|
|
|
|
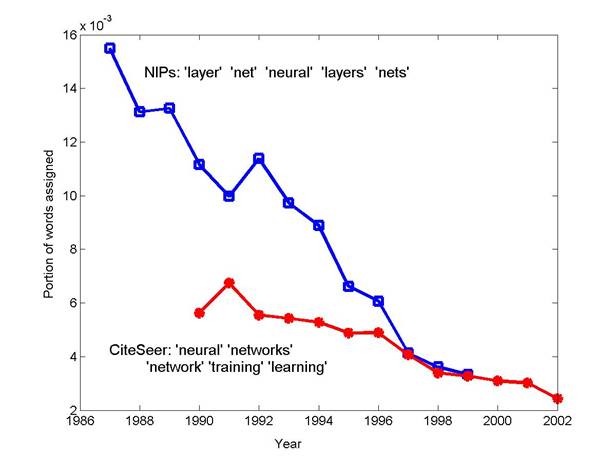
The NIPs papers are from years 1987-1999. We
used one sample from 100 topic solution and plotted the number of words from each
year assigned to a topic, divided by the total number of words in that year,
as a function of the year. Of the original 162,489 CiteSeer abstracts in our training data set, the years of publication ranged from 1990 to 2002 has been estimated by CiteSeer for 130,545 of these abstracts. We have the steady (and well-known) increase year by year in the number of online documents through the 1990's. From 1999 through 2002, however, the number of documents for which the year is known drops off sharply---the years 2001 and 2002 in particular are under-represented in this set. This is due to fact that it is easier for CiteSeer to determine the date of publication of older documents, e.g., by using citations to these documents. We used the yearly data to analyze trends in topics over time. Using the same 300 topic model described earlier, the documents were partitioned by year, and for each year all of the words were assigned to their most likely topic using the model. The fraction of words assigned to each topic for a given year was then calculated for each of the 300 topics and for each year from 1990 to 2002. These fractions provide interesting and useful indicators of relative topic popularity in the research literature in recent years. The Figure below shows the results of plotting several different topics. Each topic is indicated in the legend by the five most probable words in the topic. For more results see power point presentation. In the following figure we plotted time trends for a ‘neural network’ topic found in the 100 topic solution of the NIPs and a similar topic found in the 300 topic solution of CiteSeer
|